
Description :
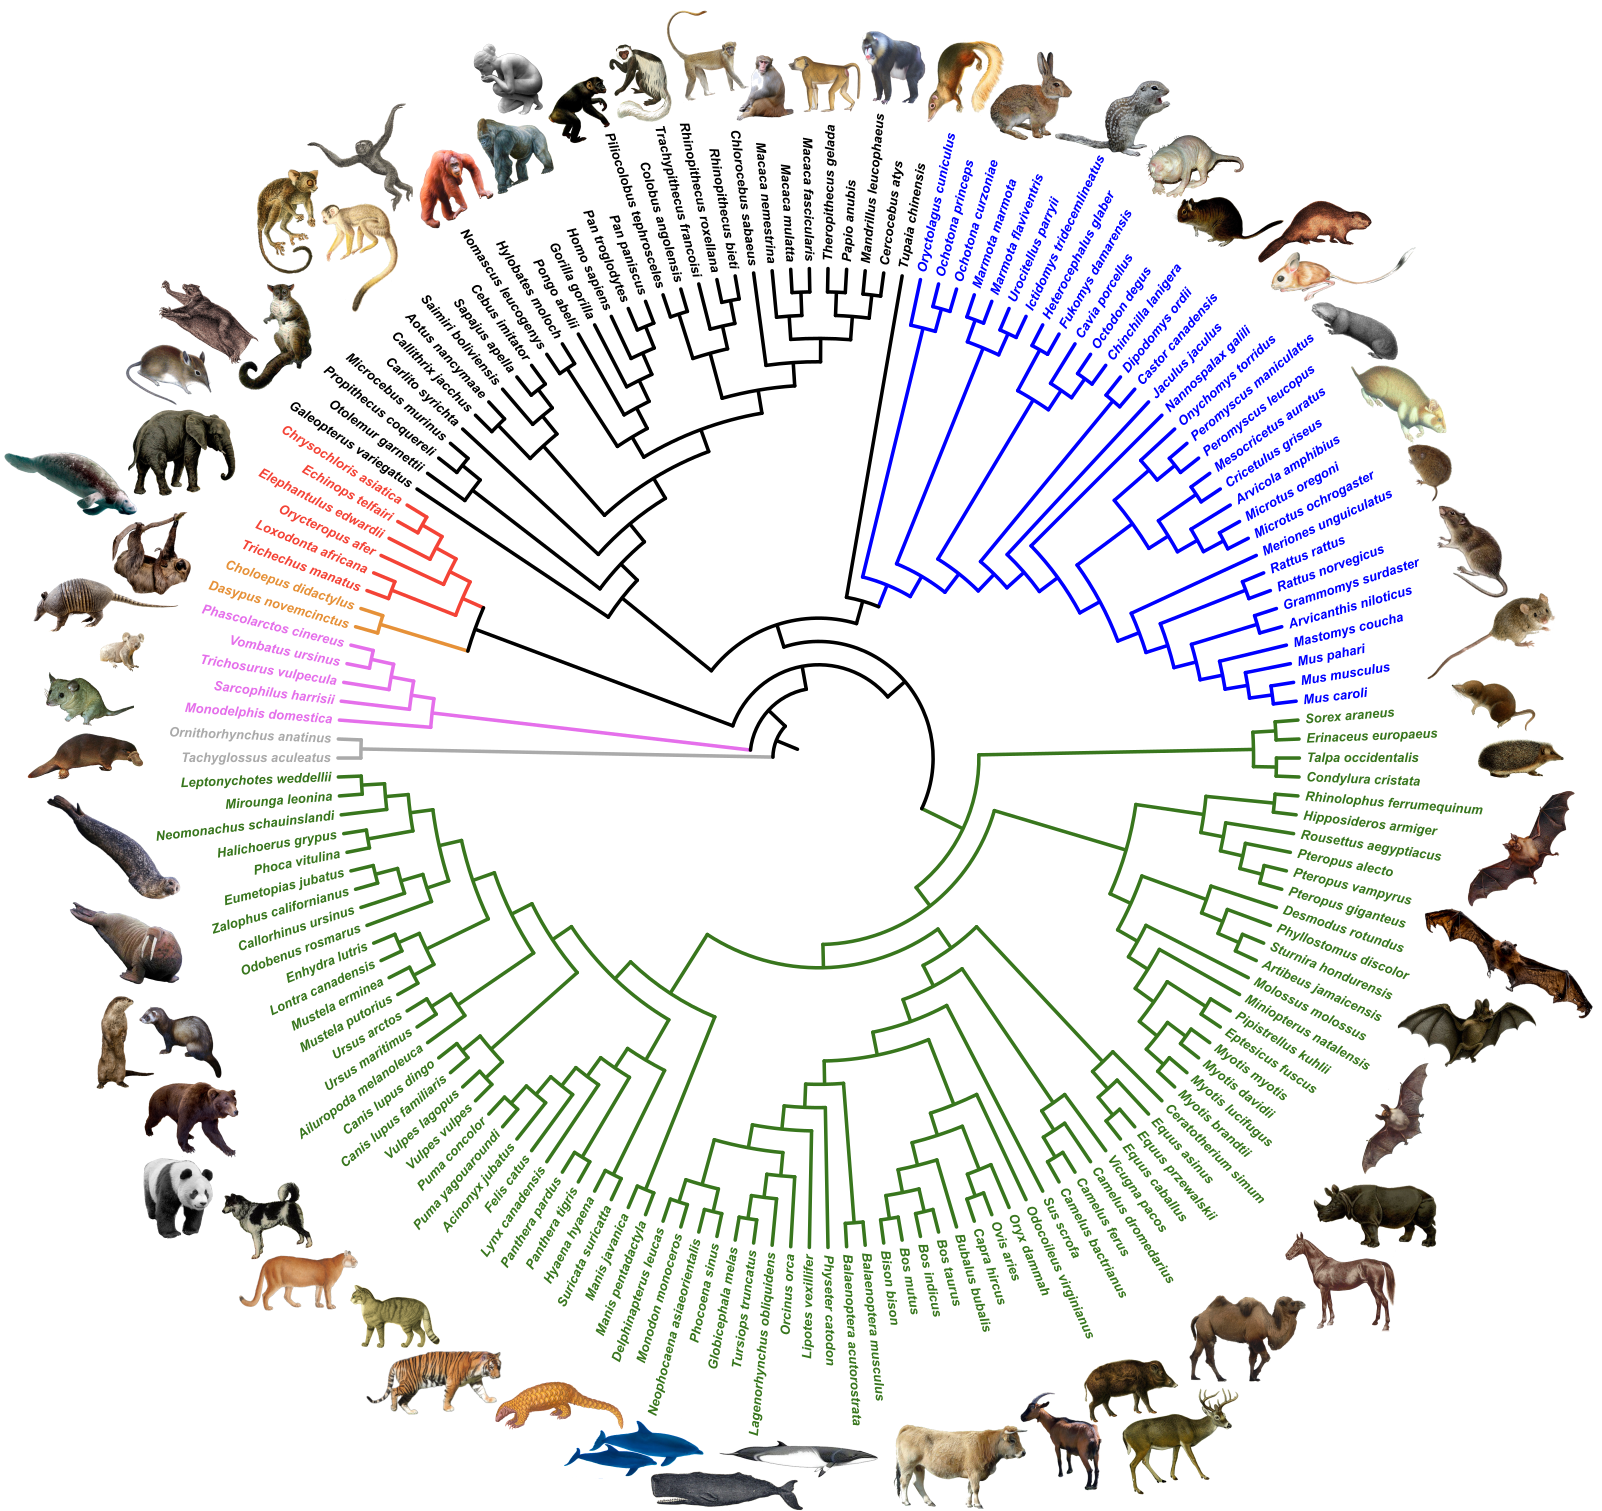
The NCBI database was used to define a set of 1-to-1 orthologous genes from available mammalian genomes from which annotated CoDing Sequences (CDSs) were extracted. The phylogenetic signal and evolutionary characteristics of these single-copy CDSs were then evaluated using a bioinformatics pipeline implementing state-of-the-art tools for sequence alignment ( MAFFT + MACSE ), alignment cleaning ( HMMCleaner + PhylteR ), and phylogenetic infrence ( IQ-TREE + ERaBLE ). The resulting OrthoMaM database of curated nucleotide and amino acid alignments and corresponding phylogenetic trees can be interrogated through this website.
If you use OrthoMam, please cite one of these references:
- The latest version - OrthoMaM v12: a database of curated single-copy ortholog alignments and trees to study mammalian evolutionary genomics Rémi Allio, Frédéric Delsuc, Khalid Belkhir, Emmanuel J P Douzery, Vincent Ranwez, Céline Scornavacca Nucleic Acids Research, gkad834
- The before last update - OrthoMaM v10: Scaling-Up Orthologous Coding Sequence and Exon Alignments with More than One Hundred Mammalian Genomes Celine Scornavacca, Khalid Belkhir, Jimmy Lopez, Rémy Dernat, Frédéric Delsuc, Emmanuel J P Douzery, Vincent Ranwez Molecular Biology and Evolution, Volume 36, Issue 4, April 2019, Pages 861–862 .BIB .ENW Google Scholar Citations
- Original paper - OrthoMaM: A database of orthologous genomic markers for placental mammal phylogenetics. Ranwez V., Delsuc F., Ranwez S., Belkhir K., Tilak M. & Douzery E. J. P. BMC Evolutionary Biology 7 : 241 , 2007. .BIB .ENW Google Scholar Citations
- Database update - OrthoMaM v8: a database of orthologous exons and coding sequences for comparative genomics in mammals. Douzery E. J. P., Scornavacca C., Romiguier J., Belkhir K., Galtier N., Delsuc F. & Ranwez V. Molecular Biology and Evolution, 31 (7) : 1923-1928 , 2014. .BIB .ENW Google Scholar Citations
Selected works that cited OrthoMaM MBE (2019) :
- 7. To What Extent Current Limits of Phylogenomics Can Be Overcome?. P Simion, F Delsuc, H Philippe. hal.archives-ouvertes.fr , 2020.
- 6. Phylogenetic tree building in the genomic age. Paschalia Kapli, Ziheng Yang & Maximilian J. Telford . Nature Reviews Genetics , 2020.
- 5. Endemic island songbirds as windows into evolution in small effective population sizes. Thibault Leroy, Marjolaine Rousselle, Marie-Ka Tilak, Aude Caizergues, Céline Scornavacca, Maria Recuerda Carrasco, Jérôme Fuchs, Juan Carlos Illera, Dawie H. De Swardt, Christophe Thébaud, Borja Milà, Benoit Nabholz. EbioRxiv, 2020.
- 4. Deep residual neural networks resolve quartet molecular phylogenies. Zhengting Zou, Hongjiu Zhang, Yuanfang Guan, Jianzhi Zhang. Molecular Biology and Evolution, Volume 37, Issue 5, May 2020, Pages 1495–1507, 2020.
- 3. Strengths and limits of multiple sequence alignment and filtering methods. V Ranwez, N Chantret. hal.archives-ouvertes.fr , 2020.
- 2. The Estimated Pacemaker for Great Apes Supports the Hominoid Slowdown Hypothesis. B Mello, CG Schrago. Evolutionary Bioinformatics , 2019.
- 1. Cutting an alignment with Ockham's razor. Mark Jones, Philippe Gambette, Leo van Iersel, Remie Janssen, Steven Kelk, Fabio Pardi, Celine Scornavacca. arXiv:1910.11041, 2019.
Selected works that cited OrthoMaM MBE (2014) :
- 31. Alignment modulates ancestral sequence reconstruction accuracy. R. A. Vialle, A. U. Tamuri and N. Goldman. , 2018.
- 30. Delimiting coalescence genes (C-genes) in phylogenomic data sets. M. S. Springer and J. Gatesy. Genes 9: 2018.
- 29. Pinniped diphyly and bat triphyly: More homology errors drive conflicts in the mammalian tree. M. S. Springer and J. Gatesy. Journal of Heredity 109: 297-307, 2018.
- 28. Human C-to-U coding RNA editing is largely nonadaptive. Z. Liu and J. Z. Zhang. Molecular Biology and Evolution 35: 963-969, 2018.
- 27. Multiple factors confounding phylogenetic detection of selection on codon usage. S. Laurin-Lemay, H. Philippe and N. Rodrigue. , 2018.
- 26. Lipidome evolution in mammalian tissues. E. Khrameeva, I. Kurochkin, K. Bozek, P. Giavalisco and P. Khaitovich.
- 25. Pervasive hybridizations in the history of wheat relatives. S. Glémin, C. Scornavacca, J. Dainat, C. Burgarella, V. Viader, M. Ardisson, G. Sarah, S. Santoni, J. David and V. Ranwez.
- 24. Geographic isolation and elevational gradients promote diversification in an endemic shrew on Sulawesi. R. A. Eldridge, A. S. Achmadi, T. C. Giarla, K. C. Rowe and J. A. Esselstyn. Molecular Phylogenetics and Evolution 118: 306-317, 2018.
- 23. In cold blood: compositional bias and positive selection drive the high evolutionary rate of vampire bats mitochondrial genomes. F. Botero-Castro, M. Tilak, F. Justy, F. Catzeflis, F. Delsuc and E. J. P. Douzery.
- 22. ExTraMapper: Exon- and Transcript-level mappings for orthologous gene pairs. F. Ay, A. Chakraborty and R. V. Davuluri.
- 21. Uncertainty in phylogenetic tree estimates. A. Willis and R. Bell. , 2017.
- 20. Incomplete lineage sorting in mammalian phylogenomics. C. Scornavacca and N. Galtier. Systematic Biology 66: 112-120, 2017.
- 19. The pace 2017 parameterized algorithms and computational experiments challenge: The second iteration. H. Dell, C. Komusiewicz, N. Talmon and M. Weller. , 2017.
- 18. Phylogenomic resolution of the phylogeny of laurasiatherian mammals: Exploring phylogenetic signals within coding and noncoding sequences. M. Y. Chen, D. Liang and P. Zhang. Genome Biology and Evolution 9: 1998-2012, 2017.
- 17. SpartaABC: a web server to simulate sequences with indel parameters inferred using an approximate Bayesian computation algorithm. H. Ashkenazy, E. L. Karin, Z. Mertens, R. A. Cartwright and T. Pupko. Nucleic Acids Research 45: W453-W457, 2017.
- 16. Large variation in the ratio of mitochondrial to nuclear mutation rate across animals: implications for genetic diversity and the use of mitochondrial dna as a molecular marker. R. Allio, S. Donega, N. Galtier and B. Nabholz. Molecular Biology and Evolution 34: 2762-2772, 2017.
- 15. Does gene tree discordance explain the mismatch between macroevolutionary models and empirical patterns of tree shape and branching times? T. Stadler, J. H. Degnan and N. A. Rosenberg. Systematic Biology 65: 628-639, 2016.
- 14. Genomic analysis reveals hidden biodiversity within colugos, the sister group to primates. V. C. Mason, G. Li, P. Minx, J. Schmitz, G. Churakov, L. Doronina, A. D. Melin, N. J. Dominy, N. T. L. Lim, M. S. Springer, R. K. Wilson, W. C. Warren, K. M. Helgen and W. J. Murphy. Science Advances 2: 2016.
- 13. LINEs between species: Evolutionary dynamics of LINE-1 retrotransposons across the eukaryotic tree of life. A. M. Ivancevic, R. D. Kortschak, T. Bertozzi and D. L. Adelson. Genome Biology and Evolution 8: 3301-3322, 2016.
- 12. Life history traits, protein evolution, and the nearly neutral theory in Amniotes. E. Figuet, B. Nabholz, M. Bonneau, E. M. Carrio, K. Nadachowska-Brzyska, H. Ellegren and N. Galtier. Molecular Biology and Evolution 33: 1517-1527, 2016.
- 11. Fast and accurate branch lengths estimation for phylogenomic trees. M. Binet, O. Gascuel, C. Scornavacca, E. J. P. Douzery and F. Pardi. , 2016.
- 10. A new orthology assessment method for phylogenomic data: unrooted phylogenetic orthology. J. A. Ballesteros and G. Hormiga. Molecular Biology and Evolution 33: 2117-2134, 2016.
- 09. Optimization of sequence alignments according to the number of sequences vs. number of sites trade-off. J. Y. Dutheil and E. Figuet. BMC Bioinformatics 16: 2015.
- 08. Neurodevelopmental lincRNA microsyteny conservation and mammalian brain size evolution. E. Lewitus and W. B. Huttner. Plos One 10: 2015.
- 07. Inferring indel parameters using a simulation-based approach. E. L. Karin, A. Rabin, H. Ashkenazy, D. Shkedy, O. Avram, R. A. Cartwright and T. Pupko. Genome Biology and Evolution 7: 3226-3238, 2015.
- 06. Gene expression, chromosome heterogeneity and the fast-X effect in mammals. L. P. Nguyen, N. Galtier and B. Nabholz. Biol Lett. 11: 20150010, 2015.
- 05. Naked but not hairless: the pitfalls of analyses of molecular adaptation based on few genome sequence comparisons. F. Delsuc and M. K. Tilak. Genome Biol. Evol. 7: 768-774, 2015.
- 04. Open source libraries and frameworks for biological data visualisation: A guide for developers. R. Wang, Y. Perez-Riverol, H. Hermjakob and J. A. Vizcaino. Proteomics 15: 1356-1374, 2015.
- 03. Assessing Associations between the AURKA-HMMR-TPX2-TUBG1 Functional Module and Breast Cancer Risk in BRCA1/2 Mutation Carriers. I. a. c.-a. Blanco. Plos One 10: 2015.
- 02. A new method for estimating species age supports the coexistence of malaria parasites and their mammalian hosts. J. C. Silva, A. Egan, C. Arze, J. L. Spouge and D. G. Harris. Molecular Biology and Evolution: 2015.
- 01. Are convergent and parallel amino acid substitutions in protein evolution more prevalent than neutral expectations? Z. T. Zou and J. Z. Zhang. Molecular Biology and Evolution 32: 2085-2096, 2015.
- 25. Pervasive hybridizations in the history of wheat relatives. S. Glémin, C. Scornavacca, J. Dainat, C. Burgarella, V. Viader, M. Ardisson, G. Sarah, S. Santoni, J. David and V. Ranwez.
Selected works that cited OrthoMaM BMC (2007) :
- 79. Stronger selective constraint on downstream genes in the oxidative phosphorylation pathway of cetaceans. R. Tian, S. Xu, S. Chai, D. Yin, H. Zakon and G. Yang. Journal of Evolutionary Biology 31: 217-228, 2018.
- 78. Divergent selection of pattern recognition receptors in mammals with different ecological characteristics. R. Tian, M. X. Chen, S. M. Chai, X. H. Rong, B. Y. Chen, W. H. Ren, S. X. Xu and G. Yang. Journal of Molecular Evolution 86: 138-149, 2018.
- 77. On the importance of homology in the age of phylogenomics. M. S. Springer and J. Gatesy. Systematics and Biodiversity 16: 210-228, 2018.
- 76. Pinniped diphyly and bat triphyly: More homology errors drive conflicts in the mammalian tree. M. S. Springer and J. Gatesy. Journal of Heredity 109: 297-307, 2018.
- 75. Hologenomic adaptations underlying the evolution of sanguivory in the common vampire bat. M. L. Z. Mendoza, Z. J. Xiong, M. Escalera-Zamudio, A. K. Runge, J. Theze, D. Streicker, H. K. Frank, E. Loza-Rubio, S. M. Liu, O. A. Ryder, J. A. S. Castruita, A. Katzourakis, G. Pacheco, B. Taboada, U. Lober, O. G. Pybus, Y. Li, E. Rojas-Anaya, K. Bohmann, A. C. Baez, C. F. Arias, S. P. Liu, A. D. Greenwood, M. F. Bertelsen, N. E. White, M. Bunce, G. J. Zhang, T. Sicheritz-Ponten and M. P. T. Gilbert. Nature Ecology & Evolution 2: 659-668, 2018.
- 74. The pace 2017 parameterized algorithms and computational experiments challenge: The second iteration. H. Dell, C. Komusiewicz, N. Talmon and M. Weller. , 2017.
- 73. Uncertainty in phylogenetic tree estimates. A. Willis and R. Bell. , 2017.
- 72. Macrosystematics of eutherian mammals combining HTS data to expand taxon coverage. M. Feijoo and A. Parada. Molecular Phylogenetics and Evolution 113: 76-83, 2017.
- 71. Mitogenomic phylogeny, diversification, and biogeography of South American spiny rats. P.-H. Fabre, N. S. Upham, L. H. Emmons, F. Justy, Y. L. R. Leite, A. C. Loss, L. Orlando, M. Tilak, B. D. Patterson and E. J. P. Douzery. , 2017.
- 70. A tree of geese: A phylogenomic perspective on the evolutionary history of true geese. J. Ottenburghs, H. J. Megens, R. H. S. Kraus, O. Madsen, P. van Hooft, S. E. van Wieren, R. P. M. A. Crooijmans, R. C. Ydenberg, M. A. M. Groenen and H. H. T. Prins. Molecular Phylogenetics and Evolution 101: 303-313, 2016.
- 69. Implementing and testing the multispecies coalescent model: A valuable paradigm for phylogenomics. S. V. Edwards, Z. X. Xi, A. Janke, B. C. Faircloth, J. E. McCormack, T. C. Glenn, B. J. Zhong, S. Y. Wu, E. M. Lemmon, A. R. Lemmon, A. D. Leache, L. Liu and C. C. Davis. Molecular Phylogenetics and Evolution 94: 447-462, 2016.
- 68. Identification and qualification of 500 nuclear, single-copy, orthologous genes for the Eupulmonata (Gastropoda) using transcriptome sequencing and exon capture. L. C. Teasdale, F. Köhler, K. D. Murray, T. O'Hara and A. Moussalli. Molecular Ecology Resources 16: 1107-1123, 2016.
- 67. The gene tree delusion. M. S. Springer and J. Gatesy. Molecular Phylogenetics and Evolution 94: 1-33, 2016.
- 66. Evolutionary genetics of hypoxia tolerance in cetaceans during diving. R. Tian, Z. F. Wang, X. Niu, K. Y. Zhou, S. X. Xu and G. Yang. Genome Biology and Evolution 8: 827-839, 2016.
- 65. Evolution of digestive enzymes and RNASE1 provides insights into dietary switch of cetaceans. Z. F. Wang, S. X. Xu, K. X. Du, F. Huang, Z. Chen, K. Y. Zhou, W. H. Ren and G. Yang. Molecular Biology and Evolution 33: 3144-3157, 2016.
- 64. The position of tree shrews in the mammalian tree: Comparing multi-gene analyses with phylogenomic results leaves monophyly of Euarchonta doubtful. X. M. Zhou, F. M. Sun, S. X. Xu, G. Yang and M. Li. Integrative Zoology 10: 186-198, 2015.
- 63. Optimization of sequence alignments according to the number of sequences vs. number of sites trade-off. J. Y. Dutheil and E. Figuet. Bmc Bioinformatics 16: 2015.
- 62. 'Obesity' is healthy for cetaceans? Evidence from pervasive positive selection in genes related to triacylglycerol metabolism. Z. F. Wang, Z. Chen, S. X. Xu, W. H. Ren, K. Y. Zhou and G. Yang. Scientific Reports 5: 1-12, 2015.
- 61. Conservation of pro-longevity genes among mammals. C. M. Lindborg, K. J. Propert and R. J. Pignolo. Mechanisms of Ageing and Development 146: 23-27, 2015.
- 60. Naked but not hairless: the pitfalls of analyses of molecular adaptation based on few genome sequence comparisons. F. Delsuc and M. K. Tilak. Genome Biol. Evol. 7: 768-774, 2015.
- 59. GUIDANCE2: accurate detection of unreliable alignment regions accounting for the uncertainty of multiple parameters. I. Sela, H. Ashkenazy, K. Katoh and T. Pupko. Nucleic Acids Research 43: W7-W14, 2015.
- 58. A targeted next-generation sequencing toolkit for exon-based cichlid phylogenomics. K. L. Ilves and H. Lopez-Fernandez. Mol. Ecol. Resour. 14: 802-11, 2014.
- 57. Practical performance of tree comparison metrics. M. K. Kuhner and J. Yamato. Syst. Biol. 64: 205-14, 2014.
- 56. Population genomics of eusocial insects: the costs of a vertebrate-like effective population size. J. Romiguier, J. Lourenco, P. Gayral, N. Faivre, L. A. Weinert, S. Ravel, M. Ballenghien, V. Cahais, A. Bernard, E. Loire, L. Keller and N. Galtier. J. Evol. Biol. 27: 593-603, 2014.
- 55. Phylostratigraphic bias creates spurious patterns of genome evolution. B. A. Moyers and J. Zhang. Mol. Biol. Evol. 32: 258-67, 2014.
- 54. Phylogenetic analysis at deep timescales: unreliable gene trees, bypassed hidden support, and the coalescence/concatalescence conundrum. J. Gatesy and M. S. Springer. Mol. Phylogenet. Evol. 80: 231-66, 2014.
- 53. Performance of genomic data sets on the estimation of the divergence time of New World and Old World anthropoids. C. G. Schrago and C. M. Voloch. Genet. Mol. Res. 13: 1425-37, 2014.
- 52. Monte Carlo algorithms for Brownian phylogenetic models. B. Horvilleur and N. Lartillot. Bioinformatics 30: 3020-8, 2014.
- 51. Indel reliability in indel-based phylogenetic inference. H. Ashkenazy, O. Cohen, T. Pupko and D. Huchon. Genome Biol. Evol. 6: 3199-209, 2014.
- 50. How low can you go? The effects of mutation rate on the accuracy of species-tree estimation. H. C. Lanier, H. Huang and L. L. Knowles. Mol. Phylogenet. Evol. 70: 112-9, 2014.
- 49. Eyes underground: regression of visual protein networks in subterranean mammals. C. A. Emerling and M. S. Springer. Mol. Phylogenet. Evol. 78: 260-70, 2014.
- 48. Development of rapidly evolving intron markers to estimate multilocus species trees of rodents. A. Rodriguez-Prieto, J. Igea and J. Castresana. PLoS One 9: e96032, 2014.
- 47. Assignment of Calibration Information to Deeper Phylogenetic Nodes is More Effective in Obtaining Precise and Accurate Divergence Time Estimates. B. Mello and C. G. Schrago. Evol. Bioinform. Online 10: 79-85, 2014.
- 46. Alignment errors strongly impact likelihood-based tests for comparing topologies. E. L. Karin, E. Susko and T. Pupko. Mol. Biol. Evol. 31: 3057-3067, 2014.
- 45. Next-generation sequencing and phylogenetic signal of complete mitochondrial genomes for resolving the evolutionary history of leaf-nosed bats (Phyllostomidae). F. Botero-Castro, M. K. Tilak, F. Justy, F. Catzeflis, F. Delsuc and E. J. Douzery. Mol. Phylogenet. Evol. 69: 728-39, 2013.
- 44. Genome-wide signatures of convergent evolution in echolocating mammals. J. Parker, G. Tsagkogeorga, J. A. Cotton, Y. Liu, P. Provero, E. Stupka and S. J. Rossiter. Nature 502: 228-31, 2013.
- 43. Evaluating phylogenetic informativeness as a predictor of phylogenetic signal for metazoan, fungal, and mammalian phylogenomic data sets. F. Lopez-Giraldez, A. H. Moeller and J. P. Townsend. Biomed Res. Int. 2013: 621604, 2013.
- 42. Adaptive evolution of the osmoregulation-related genes in cetaceans during secondary aquatic adaptation. S. Xu, Y. Yang, X. Zhou, J. Xu, K. Zhou and G. Yang. BMC Evol. Biol. 13: 189, 2013.
- 41. Novel algorithm for phylogenetic analysis of proteins: application to analysis of the evolution of H5N1 influenza viruses. V. R. Perovic. J. Math. Chem. 51: 2238-2255, 2013.
- 40. Less is more in mammalian phylogenomics: AT-rich genes minimize tree conflicts and unravel the root of placental mammals. J. Romiguier, V. Ranwez, F. Delsuc, N. Galtier and E. J. P. Douzery. Mol. Biol. Evol. 30: 2134-2144, 2013.
- 39. Evolution of functional genes in cetaceans driven by natural selection on a phylogenetic and population level. A. E. Moura, A. Natoli, E. Rogan and A. R. Hoelzel. Evol. Biol. 40: 341-354, 2013.
- 38. Efficient newly designed primers for the amplification and sequencing of bird mitochondrial genomes. S. A. Amer, M. M. Ahmed and M. Shobrak. Biosci. Biotechnol. Biochem. 77: 577-581, 2013.
- 37. Conventional simulation of biological sequences leads to a biased assessment of multi-loci phylogenetic analysis. B. O. Aguiar and C. G. Schrago. Evol. Bioinformatics 9: 317-325, 2013.
- 36. The precision of the hominid timescale estimated by relaxed clock methods. C. G. Schrago and C. M. Voloch. J. Evol. Biol. 26: 746-755, 2013.
- 35. Bayesian selection of nucleotide substitution models and their site assignments. C.-H. Wu, M. A. Suchard and A. J. Drummond. Mol. Biol. Evol. 30: 669-688, 2013.
- 34. Phylogenetic patterns of GC-biased gene conversion in placental mammals and the evolutionary dynamics of recombination landscapes. N. Lartillot. Mol. Biol. Evol. 30: 489-502, 2013.
- 33. High levels of gene expression explain the strong evolutionary constraint of mitochondrial protein-coding genes. B. Nabholz, H. Ellegren and J. B. W. Wolf. Mol. Biol. Evol. 30: 272-284, 2013.
- 32. Genomic evidence for large, long-lived ancestors to placental mammals. J. Romiguier, V. Ranwez, E. J. P. Douzery and N. Galtier. Mol. Biol. Evol. 30: 5-13, 2013.
- 31. Combining multiple autosomal introns for studying shallow phylogeny and taxonomy of Laurasiatherian mammals: Application to the tribe Bovini (Cetartiodactyla, Bovidae). A. Hassanin, J. An, A. Ropiquet, T. T. Nguyen and A. Couloux. Mol. Phylogenet. Evol. 66: 766-775, 2013.
- 30. E value cutoff and eukaryotic genome content phylogenetics. J. A. Rosenfeld and R. DeSalle. Mol. Phylogenet. Evol 63: 342-350, 2012.
- 29. EvolMarkers: a database for mining exon and intron markers for evolution, ecology and conservation studies. C. Li, J.-J. M. Riethoven and G. J. P. Naylor. Mol. Ecol. Res. 12: 967-971, 2012.
- 28. A method to find longevity-selected positions in the mammalian proteome. J. Semeiks and N. V. Grishin. PLoS One 7: e38595, 2012.
- 27. ALG11 — a new variable DNA marker for sponge phylogeny: comparison of phylogenetic performances with the 18S rDNA and the COI gene. F. Belinky, A. Szitenberg, I. Goldfarb, T. Feldstein, G. Wörheide, M. Ilan and D. Huchon. Mol. Phylogenet. Evol. 63: 702-713, 2012.
- 26. Impact of the partitioning scheme on divergence times inferred from mammalian genomic data sets. C. M. Voloch and C. G. Schrago. Evol. Bioinformatics 8: 207-218, 2012.
- 25. Fast and robust characterization of time-heterogeneous sequence evolutionary processes using substitution mapping. J. Romiguier, E. Figuet, N. Galtier, E. J. P. Douzery, B. Boussau, J. Y. Dutheil and V. Ranwez. PLoS One 7: e33852, 2012.
- 24. Comprehensive primer design for analysis of population genetics in non-sequenced organisms. A. Tezuka, N. Matsushima, Y. Nemoto, H. D. Akashi, M. Kawata and T. Makino. PLoS ONE 7: e32314, 2012.
- 23. Evolutionary and functional analyses of the interaction between the myeloid restriction factor SAMHD1 and the lentiviral Vpx protein. N. Laguette, N. Rahm, B. Sobhian, C. Chable-Bessia, J. Münch, J. Snoeck, D. Sauter, W. M. Switzer, W. Heneine, F. Kirchhoff, F. Delsuc, A. Telenti and M. Benkirane. Cell Host Microbe 11: 205-217, 2012.
- 22. Testing synchrony in historical biogeography: the case of New World primates and Hystricognathi rodents. L. Loss-Oliveira, B. O. Aguiar and C. Schrago. Evol. Bioinformatics 8: 127–137, 2012.
- 21. Model averaging and Bayes factor calculation of relaxed molecular clocks in Bayesian phylogenetics. W. L. S. Li and A. J. Drummond. Mol. Biol. Evol. 29: 751-761, 2012.
- 20. Phylogenomic analysis resolves the interordinal relationships and rapid diversification of the Laurasiatherian mammals. X. Zhou, S. Xu, J. Xu, B. Chen, K. Zhou and G. Yang. Syst. Biol. 61: 150-164, 2012.
- 19. MACSE: Multiple Alignment of Coding SEequences accounting for frameshifts and stop codons. V. Ranwez, S. Harispe, F. Delsuc and E. J. P. Douzery. PLoS ONE 6: e22594, 2011.
- 18. PhyDesign: an online application for profiling phylogenetic informativeness. F. López-Giráldez and J. P. Townsend. BMC Evol. Biol. 11: 152, 2011.
- 17. Phylogenomic analyses and improved resolution of Cetartiodactyla. X. Zhou, S. Xu, Y. Yang, K. Zhou and G. Yang. Mol. Phylogenet. Evol. 61: 255-264, 2011.
- 16. Morphology, molecular phylogeny, and taxonomic inconsistencies in the study of Bradypus sloths (Pilosa: Bradypodidae). N. de Moraes-Barros, J. A. B. Silva and J. S. Morgante. J. Mammal. 92: 86-100, 2011.
- 15. Developing a series of conservative anchor markers and their application to phylogenomics of Laurasiatherian mammals. X. Zhou, S. Xu, P. Zhang and G. Yang. Mol. Ecol. Resources 11: 134-140, 2011.
- 14. Protein structural modularity and robustness are associated with evolvability M. M. Rorick and G. P. Wagner. Genome Biol. Evol. 3: 456-475, 2011.
- 13. Novel intron markers to study the phylogeny of closely related mammalian species. J. Igea, J. Juste and J. Castresana. BMC Evol. Biol. 10: 369, 2010.
- 12. Analyzing the relationship between sequence divergence and nodal support using Bayesian phylogenetic analyses. R. Makowsky, C. L. Cox, C. Roelke and P. T. Chippindale. Mol. Phylogenet. Evol. 57: 485-494, 2010.
- 11. Contrasting GC-content dynamics across 33 mammalian genomes: relationship with life-history traits and chromosome sizes. J. Romiguier, V. Ranwez, E. J. P. Douzery and N. Galtier. Genome Res. 20: 1001-1009, 2010.
- 10. SuperTriplets: A triplet-based supertree approach to molecular systematics and phylogenomics. V. Ranwez, A. Criscuolo and E. J. P. Douzery. Bioinformatics 26: i115-i123, 2010.
- 09. An evolutionary genome scan for longevity-related natural selection in mammals. R. W. Jobson, B. Nabholz and N. Galtier. Mol. Biol. Evol. 27: 840-847, 2010.
- 08. The expansion of amino-acid repeats is not associated to adaptive evolution in mammalian genes. F. Cruz, J. Roux and M. Robinson-Rechavi. BMC Genomics 10: 619, 2009.
- 07. Covariation of branch lengths in phylogenies of functionally related genes. W. L. S. Li and A. G. Rodrigo. PLoS ONE 4: e8487, 2009.
- 06. Computer-assisted automatic classifications, storage, queries and functional assignments of orthologs and in-paralogs proteins. D. Thybert, S. Avner, C. Lucchetti-Miganeh and F. Barloy-Hubler. Curr. Bioinformatics 4: 129-140, 2009.
- 05. PhyloExplorer: a web server to validate, explore and query phylogenetic trees. V. Ranwez, N. Clairon, F. Delsuc, S. Pourali, N. Auberval, S. Diser and V. Berry. BMC Evol. Biol. 9: 108, 2009.
- 04. Reviews in comparative genomic research based on orthologs. Z.-X. Pan, D. Xu, J.-B. Zhang, F. Lin, B.-J. Wu and H.-L. Liu. Hereditas (Beijing) 31: 457-463, 2009.
- 03. GC-biased gene conversion promotes the fixation of deleterious amino acid changes in primates. N. Galtier, L. Duret, S. Glémin and V. Ranwez. Trends Genet. 25: 1-5, 2009.
- 02. IDEA: Interactive Display for Evolutionary Analyses. A. Egan, A. Mahurkar, J. Crabtree, J. H. Badger, J. M. Carlton and J. C. Silva. BMC Bioinformatics 9: 524, 2008.
- 01. PhySIC_IST: cleaning source trees to infer more informative supertrees. C. Scornavacca, V. Berry, V. Lefort, E. J. P. Douzery and V. Ranwez. BMC BioInformatics 9: 413, 2008.
Word cloud of some papers abstracts that have used and cited OrthoMaM:
Parameters
Expected number of markers * :
To delete an element in inputs fields, select it and use the 'suppr' button.
Results
For accurate filtering, you can adjust the bounds in the purple frame. Example for %GC3: 30.0 ... 40.0
Download

You can also dowload all v12 data from this Link
Database Summary
The utility of a phylogenetic marker can be described by its relative evolutionary rate (RER): faster (respectively slower) evolving markers will be more suitable for lower (respectively deeper) taxonomic levels.
In a first approximation, the total branch length (TBL) of the maximum likelihood (ML) tree is a reasonable descriptor of the evolutionary rate of a given exon / CDS. However, the TBL will preclude fair comparisons among different exons / CDS when the taxon sampling differs: the higher the species number, the longer the TBL.
To circumvent this problem, we use the Super Distance Matrix (SDM) approach [Criscuolo et al. 2006], with a three-step procedure:
- The ML tree inferred from each of the exons / CDS is converted into a matrix of additive distances by computing the path-length between each pair of species.
- Each of the matrices is brought closer to the others by a factor (αp), according to the least-squares criterion. This operation is equivalent to multiplying by αp every branch length of the initial trees.
- Optimal values of the alpha_p parameters are calculated following Criscuolo et al. (2006).
As αp are inversely proportional to the evolutionary rates, 1/αp values provide a measure of rate heterogeneities among exons / CDS even if the number of taxa differs.
Here, relative evolutionary rate SDM estimates range from 0.01 to 5 (OrthoMaM mean = 1.2 ; standard-error = 0.6). For example, if exons / CDSs X and Y are respectively characterized by relative rates rX = 0.2 and rY = 2.0, this means that Y is evolving 10 times faster than X.
Request guidelines: In the [0-5] range of values, type RER < 1 to query rather conserved markers, 1 < RER < 2 for more variable markers, and RER > 2 for fast-evolving ones.
Reference: SDM: a fast distance-based approach for (super)tree building in phylogenomics. Criscuolo A., Berry V., Douzery E. J. P. & Gascuel O. Systematic Biology 55 (5) : 740-755. 2006.
The substitution rate heterogeneity among sites of the exon / CDS alignment is described by the Γ distribution.
Lower (respectively higher) α values correspond to strong (respectively weak) heterogeneity. If α > 1, the substitution pattern among sites is rather homogeneous.
Request guidelines: In the [0-5] range of values, type alpha < 1 to query markers with stronger among-sites variability, and alpha > 1 for alignments with more evenly distributed variability.
Reference: Among-site rate variation and its impact on phylogenetic analyses. Yang Z. Trends in Ecology and Evolution 11 (9) : 367-372. 1996.
The percentage of G+C on third codon positions is a descriptor of the degree of base composition heterogeneity.
G+C content is more contrasted on third codon positions than on the whole exon / CDS.
Request guidelines:
In the [20-95] range of values, type %GC3 < 40 to query A+T rich markers,
40 < %GC3 < 60 for more equilibrated markers, and %GC3 > 60 for G+C rich markers.
Links
NCBI Datasets
- A one-stop shop for finding, browsing, and downloading genomic data
EnsEMBL
- Production and maintainance of automatic annotation on selected eukaryotic genomes
Zoonomia Project
- International collaboration to discover the genomic basis of shared and specialized traits in mammals (See Help page for a script to merge zoonomia data with Orthomam, align and infer a tree)
EnsEMBL projects
- Projects based at WTSI or EBI, and external projects
HOMOLENS
- Database of HOMOLogous sequences from ENSembl complete genomes
HOGENOM
- HOmologous sequences in complete GENOMes database
GreenPhylDB
- A phylogenomic database for plant comparative genomics
PHYLOPAT
- A database of PHYLOgenetic PATterns
OrthologID
- Automated gene Orthology IDentification in plants
UCSC Genome Browser
- University of California (Santa Cruz) reference sequence and working draft assemblies for a large collection of genomes
| Release v11 , August 2022. |
|
| Release v10c , April 2020. |
|
| Release v10b, October 2018. |
|
| Release v10a, February 2018 |
|
| Release v9, April 2015 |
|
| Release v8, October 2013 |
|
| Release v7, February 2012 |
|
| Release v6, September 2010 |
|
| v6a, July 2010 |
|
| Release v5, October 2009 |
|
| Release v4, July 2008 |
|
| Release v3, May 2008 |
|
| Release v2, March 2008 |
|
| Release v1, July 2007 |
|
Parameters
Download
Blast: Results
The resulting new alignment is then used to draw an NJ tree on pairwise distances using a JC69 model of DNA evolution.
Help
The utility of a phylogenetic marker can be described by its relative evolutionary rate (RER): faster (respectively slower) evolving markers will be more suitable for lower (respectively deeper) taxonomic levels.
In a first approximation, the total branch length (TBL) of the maximum likelihood (ML) tree is a reasonable descriptor of the evolutionary rate of a given exon / CDS. However, the TBL will preclude fair comparisons among different exons / CDS when the taxon sampling differs: the higher the species number, the longer the TBL.
To circumvent this problem, we use the Super Distance Matrix (SDM) approach [Criscuolo et al. 2006], with a three-step procedure:
- The ML tree inferred from each of the exons / CDS is converted into a matrix of additive distances by computing the path-length between each pair of species.
- Each of the matrices is brought closer to the others by a factor (αp), according to the least-squares criterion. This operation is equivalent to multiplying by αp every branch length of the initial trees.
- Optimal values of the alpha_p parameters are calculated following Criscuolo et al. (2006).
As αp are inversely proportional to the evolutionary rates, 1/αp values provide a measure of rate heterogeneities among exons / CDS even if the number of taxa differs.
Here, relative evolutionary rate SDM estimates range from 0.01 to 5 (OrthoMaM mean = 1.2 ; standard-error = 0.6). For example, if exons / CDSs X and Y are respectively characterized by relative rates rX = 0.2 and rY = 2.0, this means that Y is evolving 10 times faster than X.
Request guidelines: In the [0-5] range of values, type RER < 1 to query rather conserved markers, 1 < RER < 2 for more variable markers, and RER > 2 for fast-evolving ones.
The substitution rate heterogeneity among sites of the exon / CDS alignment is described by the Γ distribution.
Lower (respectively higher) α values correspond to strong (respectively weak) heterogeneity. If α > 1, the substitution pattern among sites is rather homogeneous.
Request guidelines: In the [0-5] range of values, type alpha < 1 to query markers with stronger among-sites variability, and alpha > 1 for alignments with more evenly distributed variability.
The percentage of G+C on third codon positions is a descriptor of the degree of base composition heterogeneity.
G+C content is more contrasted on third codon positions than on the whole exon / CDS.
Request guidelines:
In the [20-95] range of values, type %GC3 < 40 to query A+T rich markers,
40 < %GC3 < 60 for more equilibrated markers, and %GC3 > 60 for G+C rich markers.
Zoonomia genomes have been/will be progressively integrated in NCBI. Since we strongly rely on the NCBI orthology, we prefer to wait until the genomes are annotated by the NCBI consortium to fully integrate them in OrthoMaM.
However here is How to merge zoonomia data with Orthomam, align and infer a tree
#Check that singularity is installed or go to https://docs.sylabs.io/guides/3.0/user-guide/installation.html

#download OMM_MACSE singularity image
singularity pull --arch amd64 library://vranwez/default/omm_macse:v12.01

#download iq-tree
wget --no-check-certificate https://github.com/iqtree/iqtree2/releases/download/v2.2.2.7/iqtree-2.2.2.7-Linux.tar.gz
tar -zxvf iqtree-2.2.2.7-Linux.tar.gz

zoonomiaTable="overview.table.tsv"
zoonomiaALN="ENST00000678073.ACE2.fasta"
orthomamALN="59272_ACE2_NT_AL.fasta"
mixedALN="ortho_zoonomia_aln.fasta"

#download ace2 from zoonomia
wget --no-check-certificate https://genome.senckenberg.de/download/TOGA/human_hg38_reference/MultipleCodonAlignments/$zoonomiaALN.gz

#download orthomam NT alignment
wget --no-check-certificate https://orthomam.mbb.cnrs.fr/orthomam_v12/cds/omm_filtered_NT_CDS/$orthomamALN.zip

#merge orthomam and zoonomia files
gunzip $zoonomiaALN.gz

wget --no-check-certificate https://genome.senckenberg.de/download/TOGA/human_hg38_reference/$zoonomiaTable

sed -i -e 's/Microcebus sp. 3 GT-2019/Microcebus sp/' $zoonomiaTable
sed -i -e 's/REFERENCE/Homo_sapiens/g' $zoonomiaALN

unzip -j $orthomamALN.zip

# A more explicit and readable version
sed -i -e 's/-//g' $zoonomiaALN
sed -i -e 's/REFERENCE/Homo_sapiens/g' $zoonomiaALN
while IFS=$'\t' read -r Species  CommonName  ID  Lineage    Assembly    NCBI    contigN50   scaffoldN50 ; do
   sed -i -e "s/^>vs_$Assembly.*/>$Species/g" $zoonomiaALN
done < $zoonomiaTable

sed -i -e 's/ /_/g' $zoonomiaALN

cat $zoonomiaALN $orthomamALN > ${orthomamALN}_all
sed -i 's/-//g' ${orthomamALN}_all

unset species; unset species_sequence
declare -A  species_sequence
declare species

while read -r line   ; do
    if [[ $line == ">"* ]] ;
    then
        species=${line#*">"}
    else
        if [[ ${#line} -gt ${#species_sequence["$species"]} ]] ;
        then
            species_sequence["$species"]=`echo $line` #we take the longest transcript
        fi
    fi
done <  ${orthomamALN}_all

echo -n > $mixedALN
for KEY in "${!species_sequence[@]}"; do
  echo ">$KEY" >> $mixedALN
  echo "${species_sequence[$KEY]}" >> $mixedALN
done

rm ${orthomamALN}_all

# fast one pass alternative :  but less readable
# awk 'BEGIN {FS="\t"}
# {
#   if (NR == FNR) {#we are reading overview.table.tsv so create a dict mapping Assembly names to species names
#     gsub(/ /,"_",$1);    species[">vs_"$5] = $1 #replace space in species names with _
#   }
#   else {
#     if (index($0, ">") == 1) #seq ident
#     {
#       split($0, ID, " ")
#       assembly=ID[1] #keep only first part of ident which is assembly name in zoonomia
#       if (assembly in species) cur_species = ">"species[assembly] #replace assembly name with species name
#       else cur_species = assembly #probable missing assembly ident or orthomam ident
#     }
#     else {gsub(/-/,"",$0);if(length($0)>length(species_sequence[cur_species])) species_sequence[cur_species]=$0}  # remove gaps from sequence and keep the longest
#  }
# }
# END {for (sp in species_sequence) {print sp"\n"species_sequence[sp] } }
# ' $zoonomiaTable $zoonomiaALN $orthomamALN > ${mixedALN}

#Run macse

./omm_macse_v12.01.sif --in_seq_file ENST00000678073.59272_NT_AL.fasta \
 --out_dir ALIGN_ACE2_zoonomia_orthomam --out_file_prefix ACE_zoonomia_orthomam --genetic_code_number 1 --min_percent_NT_at_ends 0.2 \
 --no_filtering --no_FS_detection

#Run IQ-tree  to reconstruct a maximum-likelihood tree using ModelFinder
iqtree-2.2.2.7-Linux/bin/iqtree2 -s ALIGN_ACE2_zoonomia_orthomam/ACE_zoonomia_orthomam_final_align_NT.aln -m MFP