SPECIES FOR WHICH ORTHOLOGOUS EXONS / CDS ARE AVAILABLE
| EUARCHONTOGLIRES | ||
| Homo_sapiens | Human | v1 |
| Pan_troglodytes | Chimp | v1 |
| Gorilla_gorilla | Gorilla | v5 |
| Pongo_pygmaeus | Orangutan | v3 |
| Macaca_mulatta | Macaque | v1 |
| Tarsius_syrichta | Tarsier | v5 |
| Otolemur_garnettii | Bushbaby | v2 |
| Microcebus_murinus | Mouse lemur | v2 |
| Tupaia_belangeri | Tree shrew | v2 |
| Mus_musculus | Mouse | v1 |
| Rattus_norvegicus | Rat | v1 |
| Dipodomys_ordii | Kangaroo rat | v5 |
| Cavia_porcellus | Guinea pig | v2 |
| Spermophilus_tridecemlineatus | Ground squirrel | v2 |
| Oryctolagus_cuniculus | Rabbit | v1 |
| Ochotona_princeps | Pika | v2 |
| LAURASIATHERIA | ||
| Bos_taurus | Cow | v1 |
| Vicugna_pacos | Alpaca | v5 |
| Tursiops_truncatus | Dolphin | v5 |
| Equus_caballus | Horse | v3 |
| Canis_familiaris | Dog | v1 |
| Felis_catus | Cat | v2 |
| Myotis_lucifugus | Microbat | v2 |
| Pteropus_vampyrus | Megabat | v5 |
| Erinaceus_europaeus | Hedgehog | v2 |
| Sorex_araneus | Shrew | v2 |
| AFROTHERIA | ||
| Loxodonta_africana | Elephant | v1 |
| Procavia_capensis | Hyrax | v5 |
| Echinops_telfairi | Tenrec | v1 |
| XENARTHRA | ||
| Dasypus_novemcinctus | Armadillo | v1 |
| Choloepus_hoffmanni | Sloth | v5 |
| MARSUPIALIA | ||
| Monodelphis_domestica | Opossum | v1 |
| MONOTREMATA | ||
| Ornithorhynchus_anatinus | Platypus | v2 |

α SHAPE OF THE Γ DISTRIBUTION
The substitution rate heterogeneity among sites of the exon alignment is described by the Γ distribution.
Lower (respectively higher) α values correspond to strong (respectively weak) heterogeneity. If α > 1, the substitution pattern among sites is rather homogeneous.
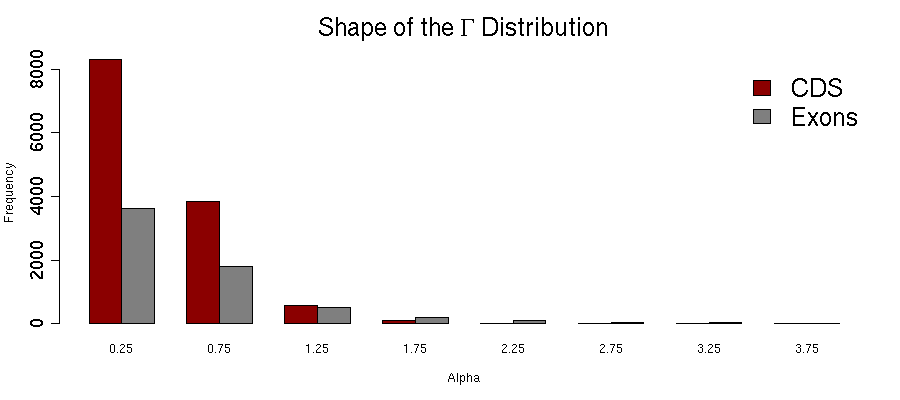
Reference: Yang Z., 1996.
Among-site rate variation and its impact on phylogenetic analyses.
Trends in Ecology and Evolutin 11 (9) : 367-372.
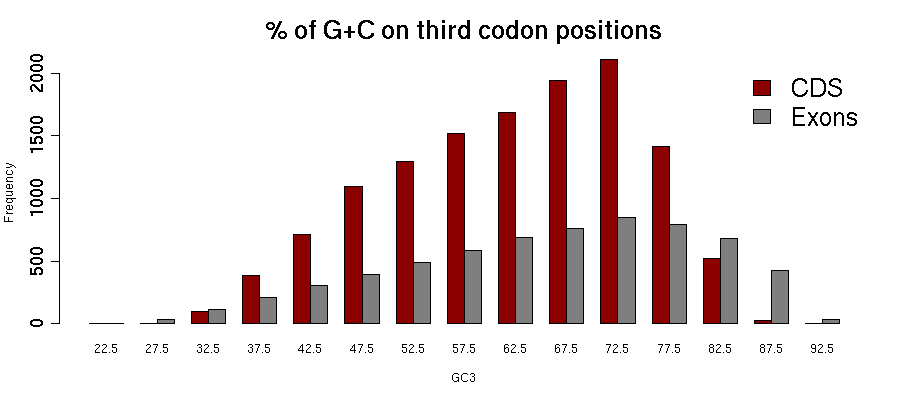
PERCENTAGE OF G+C ON THIRD CODON POSITIONS
This parameter is a descriptor of the degree of base composition heterogeneity.
It is more contrasted on third codon positions than on the whole exon.